Stylometric plots
ests.visualizers.dendrogram_plot(), ests.visualizers.pca_plot(), ests.visualizers.mds_plot(), ests.visualizers.mendenhall_plot()
Description
Plots for stylometry: a dendrogram and the multidimensional scaling of the matrix of distances of delta, the principal components of the frequencies of the most frequent words and the Mendenhall curves of several texts - the set stylo uses to look at how texts cluster by author. The functions take the axes ax and return Axes.
Dendrogram
Hierarchical clustering by scipy.cluster.hierarchy over the matrix of distances between texts; Ward's method by default, as in stylo and in Evert et al. (2015), the labels of the leaves are the names of the texts of the index of the matrix.
| Parameter | Type | Default | Description |
|---|---|---|---|
distances |
DataFrame | - |
Symmetric matrix of distances with the names of the texts |
method |
str | ward |
Method of scipy.cluster.hierarchy.linkage to join the clusters |
ax |
Axes | None |
Axes for the plot |
Principal components
Principal component analysis of the z-scores of the relative frequencies of the most frequent units (frequency_table, z_scores) through the singular value decomposition, as pca.visualization of stylo: the texts on the plane of the first two components with their names, the shares of the explained variance in the labels of the axes.
| Parameter | Type | Default | Description |
|---|---|---|---|
corpus |
dict[str, list[str]] | - |
Units of the texts by the names of the texts |
n_mfw |
int | 100 |
Number of the most frequent units; None - all of them |
culling |
float | 0.0 |
Smallest share of the texts a unit occurs in |
ax |
Axes | None |
Axes for the plot |
Multidimensional scaling
Classical multidimensional scaling (Torgerson 1952) of any matrix of distances: the double centering of the matrix of squared distances and the two leading eigenvectors; the distances between the points approximate the distances of the matrix.
| Parameter | Type | Default | Description |
|---|---|---|---|
distances |
DataFrame | - |
Symmetric matrix of distances with the names of the texts |
ax |
Axes | None |
Axes for the plot |
Mendenhall curves
The shares of the words by length in characters (mendenhall_curve) of every text on one plot - a comparison of the profiles of authors.
| Parameter | Type | Default | Description |
|---|---|---|---|
corpus |
dict[str, list[str]] | - |
Words of the texts by the names of the texts |
ax |
Axes | None |
Axes for the plot |
Usage example
Six novels from Project Gutenberg, three by Galdós and three by Unamuno.
Example
Code:
from urllib.request import urlopen

import matplotlib.pyplot as plt

from ests import WordsExtractor
from ests.corpus import delta
from ests.visualizers import dendrogram_plot, mds_plot, mendenhall_plot, pca_plot


def gutenberg(number):
    url = f"https://www.gutenberg.org/cache/epub/{number}/pg{number}.txt"
    text = urlopen(url).read().decode("utf-8")
    start = text.index("\n", text.index("*** START OF"))
    return text[start : text.index("*** END OF")]


novels = {
    "Marianela": 17340,
    "Misericordia": 21831,
    "Torquemada": 15206,
    "Niebla": 49836,
    "Abel Sánchez": 44512,
    "La tía Tula": 44358,
}
we = WordsExtractor(lowercase=True)
corpus = {name: we.extract(gutenberg(number)) for name, number in novels.items()}
distances = delta(corpus, n_mfw=100, variant="cosine")

# Dendrogram and principal components on one figure
fig, (left, right) = plt.subplots(1, 2, figsize=(13, 5))
dendrogram_plot(distances, ax=left)
pca_plot(corpus, n_mfw=100, ax=right)

# Multidimensional scaling and Mendenhall curves
fig, (left, right) = plt.subplots(1, 2, figsize=(13, 5), layout="constrained")
mds_plot(distances, ax=left)
mendenhall_plot({name: corpus[name] for name in ("Marianela", "Niebla", "La tía Tula")}, ax=right)
Result:
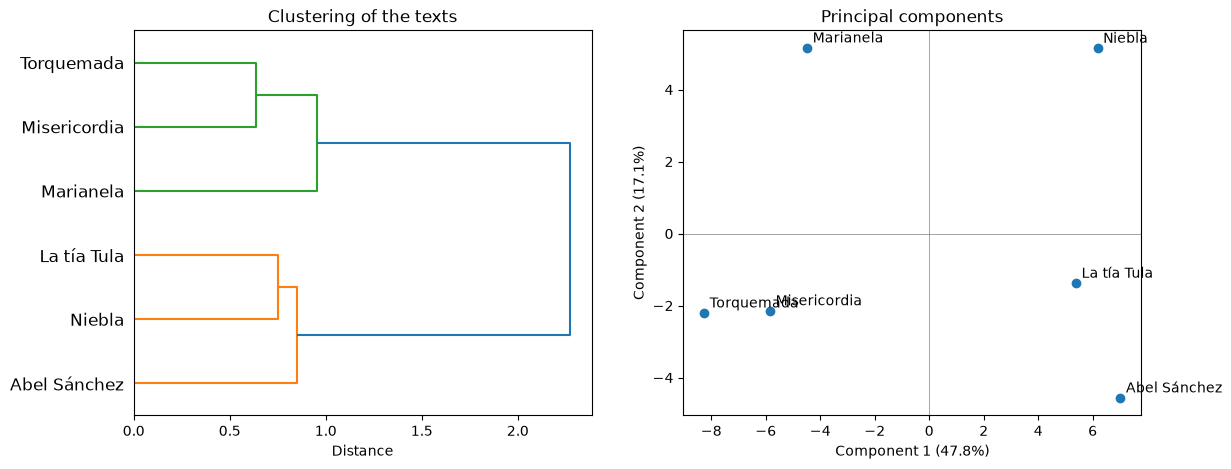
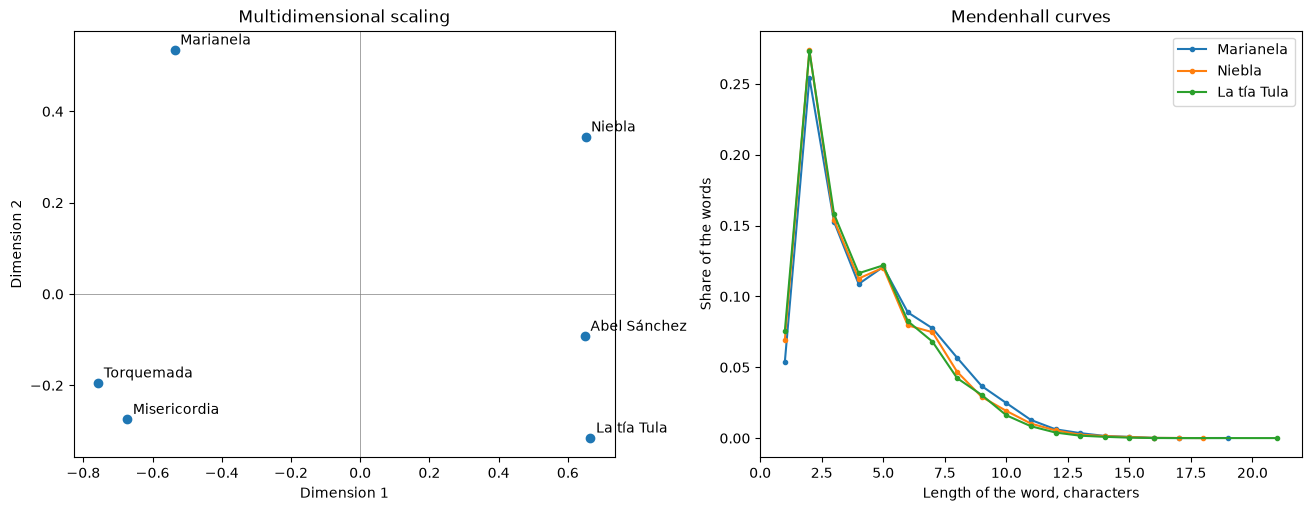
Cosine Delta over the 100 most frequent words separates the authors: the dendrogram joins the novels of each author before it joins the two groups, and the first principal component, 47.8% of the variance, puts Galdós on one side and Unamuno on the other. The Mendenhall curves hardly differ - word length is a weak feature on its own.