Zipf's law
ruts.visualizers.zipf()
Description
Plotting Zipf's law from a word frequency counter.
Definition
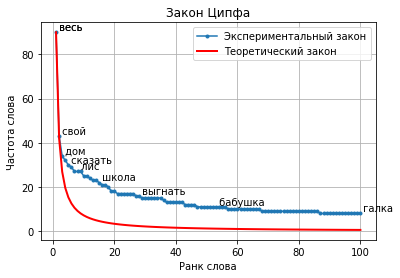
Zipf's law (the rank-frequency law) is an empirical regularity of the frequency distribution of words in a natural language: if all words of a language (or simply of a sufficiently long text) are ordered by decreasing frequency of use, the frequency of the n-th word in such a list turns out to be approximately inversely proportional to its ordinal number n (the so-called rank of the word). For example, the second most used word occurs about half as often as the first, the third - a third as often as the first, and so on.
Parameters
| Parameter | Type | Default | Description |
|---|---|---|---|
counter |
Counter | - |
Word frequency counter |
num_words |
int | None |
Number of the most frequent words |
num_labels |
int | 10 |
Number of words labeled on the plot |
log |
bool | True |
Use a logarithmic scale |
show_theory |
bool | False |
Plot the theoretical Zipf's law |
alpha |
float | 1.5 |
Coefficient α of the theoretical Zipf's law, greater than zero |
show_fit |
bool | False |
Plot the Zipf-Mandelbrot fit \(f(r) = C / (r + q)^s\) by fit_zipf_mandelbrot |
ax |
Axes | None |
matplotlib axes for the plot; if not given, a new figure is created |
The function returns the Axes with the plot; num_words larger than the number of lexemes does not extend the curves beyond the data, an empty counter raises SourceError. zipf_theory(size, num_ranks, alpha, ax) plots only the theoretical curve \(f(r) = size \cdot r^{-\alpha}\) for ranks from 1 to num_ranks.
Usage example
Let us look at the visualizer on 100 texts of the SovChLit dataset.
Example
Code:
# Import the libraries
from collections import Counter
from nltk.corpus import stopwords
from ruts import WordsExtractor
from ruts.datasets import SovChLit
from ruts.visualizers import zipf

# Prepare the data
sc = SovChLit()
texts = [text for text in sc.get_texts(limit=100)]
text = "\n".join(texts)

# Count word frequencies
we = WordsExtractor(use_lexemes=True, stopwords=stopwords.words("russian"), filter_nums=True)
tokens_with_count = Counter(we.extract(text))

# Plot
ax = zipf(tokens_with_count, num_words=100, num_labels=10, log=False, show_theory=True, alpha=1.1)
ax.figure.savefig("zipf.png")
Result: